16 candlestick patterns every trader should know before trade (Updated – 2023)
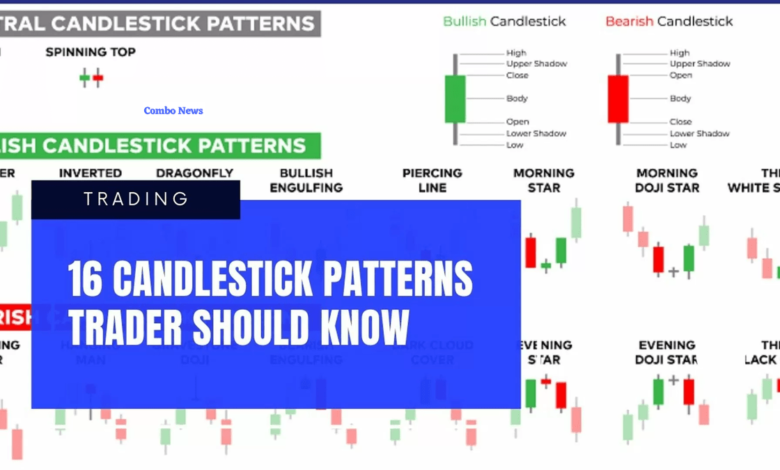
Table of Contents
What is a candlestick?
A candlestick is a type of price chart used in technical analysis that displays the high, low, open, and closing prices of a security for a specific period. It originated from Japanese rice merchants and traders to track market prices and daily momentum for hundreds of years before becoming popularized in the United States. The wide part of the candlestick is called the “real body” and tells investors whether the closing price was higher or lower than the opening price (black/red if the stock closed lower, white/green if the stock closed higher).
This article focuses on a daily chart, wherein each candlestick details a single day’s trading. It has three basic features:
- The body, which represents the open-to-close range
- The wick, or shadow, that indicates the intra-day high and low
- The color, which reveals the direction of market movement – a green (or white) body indicates a price increase, while a red (or black) body shows a price decrease
Over time, individual candlesticks form patterns that traders can use to recognize major support and resistance levels.
There are a great many candlestick patterns that indicate an opportunity within a market – some provide insight into the balance between buying and selling pressures, while others identify continuation patterns or market indecision.
Before you start trading, it’s important to familiarise yourself with the basics of candlestick patterns and how they can inform your decisions.
Six bullish candlestick patterns
Hammer
The hammer is a bullish reversal pattern that appears after a long bearish trend. It has a petite body and long lower shadow. It is a price pattern with the opening and closing prices remaining close, indicating that bears have become active but closing the price near the opening level.
The hammer candlestick pattern shows a story about market supply and demand, easily observed by watching how the candlestick forms. A long lower shadow indicates that sellers have taken the price down, failing to hold it at the new low. Later on, buyers have joined the price from the low, successfully taking the price near the daily opening level. In general, the hammer usually appears after the price of asset declines.
There are two conditions that can affect the strength of the hammer’s signal:
· After a long downtrend, the failure of sellers and the presence of buyers from a random place are more reliable than a hammer candlestick. They signify that the price has already moved a long way, and it should correct higher. However, the downside pressure depends on which time frame you’re trading. For the daily chart, every quarter or monthly closing is a time of price reversal. Moreover, the price action can change due to fundamental releases. The trading session is necessary for the intraday chart, as institutional traders remain only on a specific trading session.
· After that, it’s crucial to understand how the price closes. If the closing price is above the opening price, the hammer is more likely to take the price up. Moreover, even if the inverted hammer has a long shadow upside, it works as strong bullish reversal patterns.
Inverse hammer
When we start analyzing the stocks using this inverted hammer candlestick pattern, there are certain aspects that we should look for. Below are a few aspects which will help you in trading with an inverted hammer candlestick pattern:
Confirm the pattern: There are certain confirmation criteria that traders should consider when taking the trade using an Inverted Hammer candlestick.
- The trader should first verify that the length of the upper shadow is more than twice of the real body. If the formation for Inverted Hammers occurs with a gap down from the previous day candlestick, then the chances of reversal are stronger.
- The volume in trading should be high on the day of the formation of the Inverted Hammer candlestick pattern. High volume signifies that buyers have entered the market and expert pressure the increase the price of the stock.
- It is better to enter the buying position the next day if the price opens higher.
- Before entering into the trade, the trader must consider the above criteria to confirm the bullish reversal signal given by the Inverted Hammer.
Bullish engulfing
The bullish engulfing candle signals reversal of a downtrend and indicates a rise in buying pressure when it appears at the bottom of a downtrend. This pattern triggers a reversal of the ongoing trend as more buyers enter the market and move the prices up further.
The pattern involves two candles, with the second green candle that is completely engulfing the body of the previous red candle.
Engulfing candles helps the traders in spotting the trend reversals that indicate trend continuation and also assist traders with an exit signal:
- Trend continuation:
Engulfing patterns support the continuation of the ongoing trend. For example, when spotting a bullish engulfing pattern in an uptrend, it indicates that the ongoing trend will continue.
- Reversals:
Bullish and Bearish Engulfing patterns signal reversal in the trend. When a bullish engulfing pattern is found at the bottom of the downtrend, it signals uptrend reversal. Similarly, when a bearish engulfing pattern is found at the top of an uptrend it signals downtrend reversal
- Exit strategy:
This pattern can also be used as a signal to exit if the trader holds a buying or selling position in the ongoing trend that is coming to an end.
Piercing line
A Piercing line candlestick pattern is a two-day bullish candlestick reversal pattern that appears in a downtrend. It signals a potential short-term reversal from downwards to upwards. It consists of two major components, a bullish candle of day 2 and a bearish candle of day 1.
The Piercing pattern depends upon the near high opening prices of day 1 followed by the near low closing prices of day 2. The trading range of the Piercing pattern may vary from an average to a larger size. The gap down after the first day is also part of this pattern. The gap shows the beginning of the day 2 trading that opens near the low and closes near the high. It is also interesting and very important to note that day 2’s price gap downs are only for the sake of filling gaps. It usually closes into the losses made in the first day’s bearish candlestick. Being a bullish candlestick pattern, Piercing Pattern prompts a trend reversal when the bulls push prices high.
Morning star
The Morning Star pattern is a three-candle, bullish reversal candlestick pattern that appears at the bottom of a downtrend. It reveals a slowing down of downward momentum before a large bullish move lays the foundation for a new uptrend.
HOW TO IDENTIFY A MORNING STAR ON FOREX CHARTS
Identifying the Morning Star on forex charts involves more than simply identifying the three main candles. What is required is an understanding of previous price action and where the pattern appears within the existing trend.
- Establish an existing downtrend: The market should be exhibiting lower highs and lower lows.
- Large bearish candle: The large bearish candle is the result of large selling pressure and a continuation of the existing downtrend. At this point, traders should only be looking for short trades as there is no evidence of a reversal yet.
- Small bearish/bullish candle: The second candle is a small candle – sometimes a Doji candle – that presents the first sign of a fatigued downtrend. Often this candle gaps lower as it makes a lower low. It does not matter if the candle is bearish or bullish, as the main takeaway here is that the market is somewhat undecided.
- Large bullish candle: The first real sign of new buying pressure is revealed in this candle. In non-forex markets, this candle gaps up from the close of the previous candle and signals the start of a new uptrend.
- Subsequent price action: After a successful reversal, traders will observe higher highs and higher lows but should always manage the risk of a failed move through the use of well-placed stops.
Three white soldiers
The three white soldiers’ candlestick pattern is a bullish pattern that appears during a downtrend. It indicates an upcoming reversal of the prevailing downtrend in the market to an uptrend. There are numerous trading chart patterns, but really useful are those that are in the right context of the market. The three white soldiers pattern is among those and is one of the most reliable patterns. Gregory L. Morris, a trading legend, in his book “Candlestick Charting Explained”, said that the three white soldiers’ candlestick pattern should not be ignored. He said it was the most reliable and rewarding pattern if traded correctly.
How to identify the three white soldiers’ candlestick pattern?
The three white soldiers pattern is a pattern with three candlesticks that makes it a challenging pattern to identify. It must have the following characteristics that are hints to identify it as well.
- The three white soldiers’ candlestick patterns must have three consecutive bullish candlesticks.
- All three candles must open and close higher than the previous candle.
- The body of the second candle must be bigger than the first candle.
- The second and third candles must have approximately the same size.
- All three candles must have no wicks or very small wicks. It indicates that the buyers managed to take control of the market. It shows they were able to close the prices at the high of a candle.
- The three white soldiers pattern forms at a support zone when three consecutive long bullish candles follow a downtrend and signal a time of reversal to rally.
Six bearish candlestick patterns
Hanging man
Hanging man is a bearish reversal candlestick pattern that has a long lower shadow and a small real body. This candlestick pattern appears at the end of the uptrend indicating weakness in further price movement. It is formed when the bulls have pushed the prices up, and now they are not able to push further.
This candlestick chart pattern has a small real body which means that the distance between the opening and closing price is very less. There is no upper shadow, and the lower shadow is twice the length of its body.
This pattern provides an opportunity for traders to squaring their buy position and enter a short position.
Criteria for Identifying this pattern:
Below are some points that should be kept in mind when identifying this pattern on the candlestick charts:
- There so be no or little upper shadow
- The lower shadow should be long as twice the length of the real body
- The real body should be on the upper side of the candlestick.
Shooting star
The shooting star has a small body and a very long upper candlewick. As you see, the candle has a small body located in the lower part of the Pattern. However, this also looks like an inverted hammer candle pattern.
3 Steps to Trading the Shooting Star
- Trade Entry
Before entering a shooting star trade, you should first confirm the pattern. Here are a handful of criteria to ensure success:
- Identify an active bullish trend.
- Spot a candle with a small body and a big upper candlewick.
- Wait for a bearish candle to break the low point of the shooting star body.
- Ensure elevated volume, signifying heavy supply
- This will confirm the validity of your shooting star on the chart.
If you are able to identify the presence of these signals, then you should short the security. After all, you are anticipating an upcoming bearish price move.
- Stop Loss
You should always use a stop-loss order when trading the shooting star candle pattern. After all, nothing is 100% guaranteed in stock trading, and you may experience false signals when trading the shooting star pattern.
For this reason, place the shooting star candle pattern above the upper wick of the pattern.
- Taking Profits
The price target for the shooting star is equal to the size of the pattern (the length of the candle). Similarly, our target is for a price move equal to three times the length of the shooting star, including the wick.
Bearish engulfing
A Bearish Engulfing pattern can be recognized by a green (bullish) candlestick followed by a red (bearish) candlestick that eclipses or engulfs it in size. For a pattern to qualify as a Bearish Engulfing pattern, the opening price of the bearish candlestick must be equal to or greater than the closing price of the bullish candlestick.
The closing price of the bearish candlestick is lower than the opening price of the bullish candlestick from the previous day (or periods). Hence, the real body of the bearish candlestick must engulf the real body of the bullish candlestick. The greater the difference between the two, the more significant the market indication prompted by the Bearish Engulfing Pattern.
How to trade using Bearish Engulfing Candlestick?
There is a certain element of fear or risk involved in following the Bearish Engulfing candlestick pattern. Since it is inherently a method of trading against the trend and it can be your friend, market reversals do happen and, a Bearish Engulfing pattern is an extremely useful indicator of a potential shift in market direction.
The simplest way to trade using a bearish candlestick pattern would be to identify this pattern after a consistent upward trend. However, this can be a risky place to make your decision on taking a short position. Instead, wait for the consecutive day, and if the market continues to fall, you can then plan and take your position.
For those who wish to hold back on risks even further, you can wait for a gap to open up after the bearish engulfing pattern is spotted. A downward gap occurs when the opening price for a trading day opens below the closing price for the previous trading day. In this case, after the day, the bearish engulfing candlestick is observed. If you wish to further minimize your losses in the case of your prediction being incorrect, make sure you set a stop loss above the high wick of the second candle in the bearish engulfing candlestick pattern.
Evening star
The Evening Star is a bearish, top trend reversal pattern that warns of a potential reversal of an uptrend. It is the opposite of the Morning Star and, like the morning star, consists of three candlesticks, with the middle candlestick being a star. The first candlestick in the evening star must be light in color and must have a relatively large real body. The second candlestick is the star, which is a candlestick with a real short body that does not touch the real body of the preceding candlestick. The gap between the real bodies of the two candlesticks is what makes a doji or a spinning top a star. The star can also form within the upper shadow of the first candlestick. The star is the first indication of weakness as it indicates that the buyers were unable to push the price up to close much higher than the close of the previous period. This weakness is confirmed by the candlestick that follows the star. This candlestick must be a dark candlestick that closes well into the body of the first candlestick.
The reliability of the evening star is enhanced if the third candlestick opens below the real body of the star, leaving a gap between the real bodies of the star and the third candlestick. This, however, occurs very rarely. Reliability is also enhanced by the extent to which the real body of the third candlestick penetrates the real body of the first candlestick and if the third candlestick has very little or no lower shadow. Finally, the volume should also be considered as the pattern is more reliable if the volume on the first candlestick is lower and the volume on the third candlestick is higher.
Three black crows
The three black crows pattern is a bearish reversal pattern consisting of three consecutive bearish long candlesticks that trend downward like a staircase. This pattern forms at the peak of an uptrend and indicates a strong reversal in the stock price. The continuous downward movement highlights the strength of the bears and they are now in charge of the stock.
Each of the three candlesticks should be long-bodied bearish candlesticks, and each candlestick’s opening price should be lower than the opening price of the previous candlestick. The opening of one candle is slightly higher than or almost at the same level as the close of the previous candle. A pattern opposite the three black crows is called three white soldiers. This is a bullish reversal formation that occurs in a strong downtrend and signals a change in direction.
As with the bearish formation, the three white soldiers consist of three consecutive bullish candles, with each one of them closing higher than the previous candle.
What the Three Black Crow Pattern Looks Like
The three black crows are identified as three red (or black) candlesticks in a row where each candle opening is lower than the previous bars open.
Here is a list of the conditions that must be met for the pattern to form:
· There must be three negative candlesticks
· All three should close in the lower fourth of the range.
· The upper wicks should not be very tall
So, for a valid signal, the open price of each candlestick ought to be lower than the last open, and the close should be lower than the close of the last. The pattern should form at or near a chart top so that the first bar makes a recent high.
Dark cloud cover
The dark cloud cover refers to a candlestick pattern in technical analysis that is a bearish reversal signal. It is observed when a “down” candle opens above the close of the previous “up” candle and proceeds to close below the midpoint of the “up” candle within a candlestick chart. Japanese CandlestickJapanese Candlesticks are a technical analysis tool that traders use to chart and analyze the price movement of securities. The concept of candlestick charting was developed by Munehisa Homma, a Japanese rice trader.
The dark cloud cover is a pattern or single that is observed within technical analysis. Technical analysis is a discipline that is applied by security traders who observe patterns within historical trading data and attempt to analyze securities with this data. Generally, technical analysis traders will observe charts that give information about the price movement or trading volume of securities to draw insights on future price movements.
Clearly, technical analysis is more of a short-term trading discipline that does not involve long-term fundamental analysis of individual securities. Instead, technical analysis will focus on short-term trading signals that can evaluate a security’s investment attractiveness based on a comparison between that security’s charts and patterns against the charts and patterns of its own history or other securities.
Four continuation candlestick patterns
Doji
Candlestick charts are a unique form of trading indicators invented in 17th century Japan by rice traders. They used these patterns to anticipate price movements to trade. Modern traders use a variety of candlestick patterns. Among those Doji is one. In Japanese, Doji means mistake or blunder. It often appears during an uptrend or a downtrend, signifying equality between bullish and bearish trends.
How will you recognize a Doji candlestick when you see one? Well, it looks like a cross or star, hence the name Doji Star. The difference between Doji and other candlestick patterns is it has no real body. The opening and closing values are the same, with different high and low. A long-legged Doji, with long upper and lower shadows, is called a “Rickshaw Man”.
Since a Doji is often formed during an uptrend or downtrend, it is considered a possible indication of a trend reversal.
Spinning top
The spinning top candlestick chart pattern is a formation that occurs when buyers and sellers balance each other out, resulting in similar opening and closing price levels. Because of this relatively small change in market direction, this candlestick is known as a continuation pattern.
There are two variations of this chart pattern: the bullish spinning top (green in color) and the bearish spinning top (red in color). The bullish formation occurs when the closing price is higher than the opening price, while the bearish pattern occurs when the opening price is higher than the closing price.
Like all candlestick patterns, the spinning top has a wick and a body:
- The wick is formed by the vertical line, while the body is formed by the horizontal lines
- The length of the wick can vary, as the top represents the highest price and the bottom represents the low
- The body can vary in height, too, as it represents the difference between the opening and closing price
Falling three methods
The Falling Three Methods is the opposite of the rising three methods and appears in a downtrend. The first candlestick in this pattern is a dark bearish candlestick with a large real body. The following few candlesticks should be smaller rising candlesticks that are bullish and light in color. These candlesticks should not exceed the high or the low of the first candlestick. The last candlestick that completes the pattern should be below the close of its preceding candlestick and should close lower than the close of the first candlestick.
As seen from a downtrend and the long black candle at the start of the signal, the bears are dominating the bulls. But after that, the price pauses for a moment and forms the three short candles in the center, within the range of the first candle. The bulls aren’t able to push the price above the height of that first long candle, and they are passed by the bears. In the end, the price goes down again, making another long black candle that closes lower than the first candle.
Each candlestick pattern tells traders something about the market, how it behaved, and maybe why it behaved as it did. And while it might be difficult or impossible to determine the exact reasons why the market moved as it did, analyzing candlestick patterns in an attempt to understand their meanings is a great exercise that will help you understand the market.
Rising three methods
When this occurs, it means that the bulls are dominating the bears. This is obvious from the presence of the first long candle, which is green in color. But they stutter a bit after that. The price stops, and three or more small candles form within the range of the first candle. The bears are pushing for a comeback but are unable to force the price lower than the first candle. In the end, the bulls overcome them once more, push the price upward, and form another long green candle. We can conclude from this that the bulls are still in control, and the uptrend will go on.
Trading the Rising Three Methods
Entry point
Traders can enter the market when the last bar in the pattern closes. Alternatively, a trade could be taken when the price goes above the high of the final candle. Enthusiastic traders may look for an entry before the last bar closes but have to be prepared to leave if the fifth bar fails to complete the pattern.
Take profit
Traders should ensure that the rising three methods pattern is not found at the bottom of important resistance to make sure that the uptrend has enough room to carry on. For example, a trend line or widely used moving average slightly above the pattern could prevent further gains. Resistance levels should be checked on longer-term charts to increase the probability of a successful trade. The rising three methods may be more efficient if the wick of the previous bullish candlestick, showing the high and low traded price for that period, are shallow and if it forms above a whole number.
Also Read: How to Trade in Forex if You Are a Busy Person
Which candlestick pattern is best for trading?
Which candlestick pattern is the most trustworthy? Different traders like certain patterns and consider them to be the most dependable. The most well-known ones are bullish/bearish engulfing lines, bullish/bearish long-legged doji, and bullish/bearish abandoned baby top and bottom.
Which candlestick pattern is most reliable for day trading?
One of the most dependable and effective candlestick patterns for intraday trading is the shooting star candlestick. Instead of a hammer candle, which indicates a bottom trend, you will generally observe a bearish reversal candlestick in this sort of intra-day chart, which signals a peak.
Can you trade just using candlestick patterns?
A single candlestick design, as its name indicates, is made up of just one candle. As you might expect, the trade signal is produced based on one day’s worth of trading activity. As long as the pattern has been correctly identified and applied, trading based on a single candlestick pattern has the potential to be very profitable.
Which candlestick time is best?
The most popular time frame charts for intraday trading, if we’re talking about the finest candlestick time frame for day trading, are the 5-minute and 15-minute candlestick charts. The candlesticks have four points, which are sometimes referred to as OHLC (open high low close).
How do you know if a candlestick pattern is strong?
One of the most potent candlestick patterns is the engulfing pattern, which has two candles. It happens when the second candle, the newest candle, totally engulfs or eclipses the first candle. Symbolically, it denotes that either buyers have outnumbered sellers or vice versa.